StKilda all time WL ratios (2010)

This unofficial St Kilda Saints fan forum is for people of all ages to chat Saints Footy and all posts must be respectful.

Moderators: Saintsational Administrators, Saintsational Moderators

Post Reply
User avatar
Enrico_Misso
Saintsational Legend
Posts: 11662
Joined: Tue 13 Jun 2006 12:11am
Location: Moorabbin Chapter of The Royal Society of Hagiographers
Has thanked: 315 times
Been thanked: 720 times

StKilda all time WL ratios (2010)

Post: # 1018844Post Enrico_Misso »

This is an updated version of a post I have submitted in previous years.
I have taken on board some feedback from last year and reformatted the graph slightly.
And updated the commentary.

The graph basically tries to encapsulate the history of the StKFC.
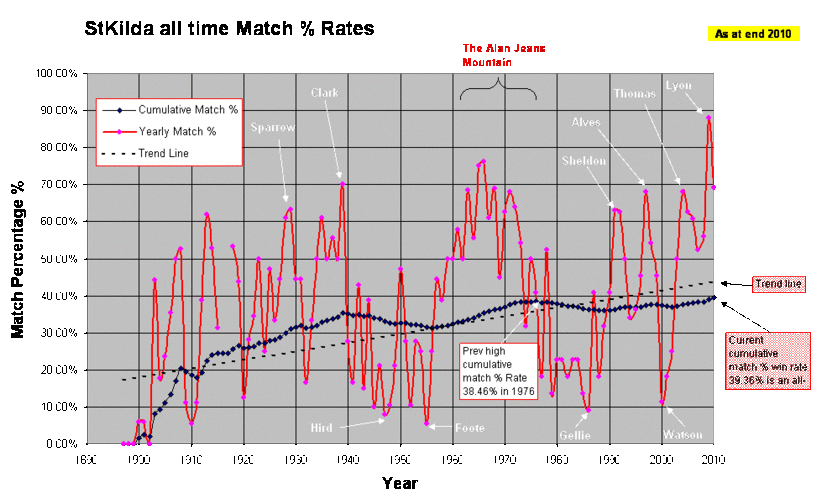
Image

LYON Mountain, LYON Hill or LYON Valley ?

The red line shows the Match % each year.
The match % = (Wins + Draws/2) / Games in season
So if you win 10 and draw 1 in a 20 game season your Match % = 10.5/20 = 52.5%.

The Black line is the cumulative version of the red line ie our all time record to that point

The dotted Black line is a trend line (line of best fit using linear regression) to illustrate the long term trend.
It is somewhat misleading as it's steep upward gradient is more due to the influence of our dismal first 15 years


Conclusions
A bleak start to our VFL career saw us sitting on 0% until our 4th year
It took till 1905 before our cumulative Match % reached 10%.
By 1908 we reached 20% before dipping back to 18%
It took till 1929 to pass the 30% barrier
We hit a high of 38.46% in 1976 in the last year of Allan Jeans' reign.
After the "lost decade" of the 80s we dropped back to below 36% in 89.
Under Sheldon, Alves and Thomas we have steadily recovered ground.
Under Lyon we have hit our all time high.

So what is our all time high ?
In 2008 we passed the old mark of 38.46% and finished on 38.43%
2009 saw it rise to 39.00%.
We finished 2010 at 39.36% - our all time (year end) high.

When will we hit the 40% barrier ?
To achieve that we would need to win 24 more games (or accrue 24 more wins than losses).
So it will take 3 very good seasons with 16-8 results (net gain of 8).
To put that in perspective in 2010 we had a net gain of 10 (17W 2D 7L).

Selective viewings of history ?
Pre and post Jeans
If you define StK in terms of the influence of Allan Jeans then
- our record before Jeans commenced coaching in 61 was 32.3%
- and 46.3% since he took over in 61
His personal record was 58.1% with 196 wins and 1 draw in 338 matches
His influence can never be understated.

The "Modern" era
If you define the modern era as commencing with Kenny's manifesto in 1990, then
- our record since Sheldon took over is an impressive 51.3% (and that includes Watson/Blight)

The Four Decades of Shame
In many ways we are still recovering from our dismal dark days prior to 1910, the 40s, the 50s and the 80s
- excluding those 4 decades of shame our overall rate is 48.7% (covering 70 years)
- or conversely those 4 decades of shame produced a rate of only 23.0% (covering 43 years)
It is no surprise that we won 20 of our 26 wooden spoons in those periods
And of the other 6 spoons, the one in 1910 and the two in the late 70s would roll into the decades of shame if I was slightly more flexible in defining those dark periods.
(For completeness sake the other 3 spoons consisted of two in the 20's and the Watson spoon in 2000).

Or Three eras of Shame
In fact if I add 5 more years (1910-11, 1977-9) into our three eras of shame to become 1897-1911, 1940-1959, and 1977-1989
Those three dark eras cover 48 years and 23 wooden spoons, during which our win ratio was a dismal 22.7%
Then our Match rate in the 66 years not covered by these periods is a very respectable 50.9%

What is the "Pass mark" for a successful club?
50% is probably the "pass" mark as it is the point above which you have won more than you have lost.

Could we reach 50% in our lifetime ?
Not unless you are into cryogenics.
We need another 467 (net) wins to reach the 50% benchmark.
That would take almost 19 consecutive "perfect" seasons (25W 0L)
If you define a goodish season as say 14 wins and 10 losses.
Then it would require 117 consecutive goodish average seasons before we reached 50%, so bookmark 2127.

Basically it will take many many many more respectable decades to obliterate the impact of those three unsuccessful eras.


The stand-out feature of the graph is the impact of Allan Jeans
His reign from 1961 to 1976 is obvious from the red graph.
His impact is also obvious in the form of a distinct lump in the cumulative curve.
I have called this phenomena "The Allan Jeans Mountain".

The impact of other coaches can also be seen.
Sheldon, Alves and Thomas were also consistently above average.
And the impacts of coaches Watson and Gellie is obvious to see, I have named valleys after them !
From earlier eras George Sparrow and Ansell Clarke had spikes, whilst Allan Hird and Les Foote had dips.
Indeed prior to Allan Jeans we only had 4 coaches who coached for more than two consecutive years (Minogue, Clarke, Froude and Killigrew) and they each managed only 3 years.
ie before Jeans no-one coached us for more than 3 consecutive years.
So the StK coaching position was pretty much a revolving door prior to Jeans, making it hard to name spikes or dips after individual coaches.
Note that prior to McNamara in 1913 we did not have a coach, just a captain as per the custom of that era.

Lyon
Ross has had 4 years in the job.
His average so far in 98 games is an extremely impressive 66.84%
In that time he has lifted us 1.28% from 38.08% to 39.36%
Already we can see the cumulative curve starting to turn upwards.

Questions
Will Lyon take us to beyond the 40% threshold?
Will Lyon be a Mountain, a Hill or a Valley ?


The rest of Australia can wander mask-free, socialise, eat out, no curfews, no zoning, no police rings of steel, no illogical inconsistent rules. 
They can even WATCH LIVE FOOTY!
User avatar
kosifantutti23
SS Hall of Fame
Posts: 2388
Joined: Fri 26 Sep 2008 12:55am
Location: Horgen

Post: # 1018849Post kosifantutti23 »

Well done Enrico, a real tour de force.

I hope that one day we will refer to this period as the start of the Lyon plateau.


Furtius Quo Rdelious
bergholt
Saintsational Legend
Posts: 7356
Joined: Wed 11 Aug 2004 9:25am

Post: # 1018857Post bergholt »

i can't add anything to this post, but i just want to express my extreme admiration for it. every time you post this graph i think it's a beautiful use of statistics.


User avatar
#1GILL
SS Hall of Fame
Posts: 2310
Joined: Sun 28 Sep 2008 1:15pm
Location: Berwick

Post: # 1018867Post #1GILL »

Trend line looks good :!:

Good work Enrico_Misso


User avatar
Life Long Saint
Saintsational Legend
Posts: 5424
Joined: Tue 09 Mar 2004 12:54pm
Has thanked: 60 times
Been thanked: 460 times
Contact:

Post: # 1018930Post Life Long Saint »

This is a super graph...Great work!

The only relevance, though, is how we've done since 1986 when the draft came in and the league expanded to include Brisbane and West Coast.

The next phase would be from 1991 when the Crows came into the competition.

Then 1995 when Fremantle came in.

Then, finally, 1997 when Port Adelaide came in and Fitzroy merged with Brisbane.

We are about to embark on a new era with Gold Coast and Greater Western Sydney coming into the comp to change the playing field again.

I'd like to see a comparison against other clubs through these eras.


User avatar
GrumpyOne
Saintsational Legend
Posts: 8163
Joined: Wed 17 Mar 2010 9:25am
Location: Kicked out of the Coffee Shop, Settlement Pub, Cranbourne

Post: # 1018932Post GrumpyOne »

Superlative Enrico, thanks for posting.


Australia...... Live it like we stole it....... Because we did.
Richter
SS Life Member
Posts: 3914
Joined: Wed 30 Nov 2005 1:18pm
Location: Elwood

Post: # 1018942Post Richter »

Wow!

Great piece of work mate.

:D :shock:


Hird... The unflushable one is now... just a turd...
suss
Club Player
Posts: 1928
Joined: Sun 22 May 2005 11:42pm
Has thanked: 7 times
Been thanked: 90 times

Post: # 1018945Post suss »

Interesting graph but it kinda confirmed something I already knew - Tim Watson was the football equivalent of big crash leading to a Great Depression.


User avatar
Life Long Saint
Saintsational Legend
Posts: 5424
Joined: Tue 09 Mar 2004 12:54pm
Has thanked: 60 times
Been thanked: 460 times
Contact:

Post: # 1018956Post Life Long Saint »

Since the introduction of the draft and salary cap (1986/87) we have a winning percentage of 48.8%

In that time we have:
* Played 550 games
* Won 265
* Lost 278
* Drawn 7

* Made the finals 10 times (every 2.4 years)
* Made four grand finals (including two this year)
* Won the minor premiership twice
* Won two wooden spoons


Sainterman
Club Player
Posts: 1497
Joined: Wed 24 Mar 2004 11:45am

Post: # 1018959Post Sainterman »

That really is fantastic work, great stuff. Enjoyed the read.

Let us all hope Lyon takes us up over 40%, but even more importantly, gets us that second flag!

I too would be interested in seeing the trendline for all clubs up against eachother...be great as a comparison.


User avatar
ChicagoSaint
Club Player
Posts: 1405
Joined: Tue 13 Jul 2010 3:15pm
Location: Seaford

Re: StKilda all time WL ratios (2010)

Post: # 1018975Post ChicagoSaint »

Enrico_Misso wrote:When will we hit the 40% barrier ?
To achieve that we would need to win 24 more games (or accrue 24 more wins than losses).
So it will take 3 very good seasons with 16-8 results (net gain of 8).
To put that in perspective in 2010 we had a net gain of 10 (17W 2D 7L).
What have you against 17-8 (net gain of 9) as a season Enrico_Misso?


User avatar
Enrico_Misso
Saintsational Legend
Posts: 11662
Joined: Tue 13 Jun 2006 12:11am
Location: Moorabbin Chapter of The Royal Society of Hagiographers
Has thanked: 315 times
Been thanked: 720 times

Post: # 1019020Post Enrico_Misso »

Yes 17-8 is better, particularly if the last one is a win :D


The rest of Australia can wander mask-free, socialise, eat out, no curfews, no zoning, no police rings of steel, no illogical inconsistent rules. 
They can even WATCH LIVE FOOTY!
User avatar
ChicagoSaint
Club Player
Posts: 1405
Joined: Tue 13 Jul 2010 3:15pm
Location: Seaford

Post: # 1019040Post ChicagoSaint »

Enrico_Misso wrote:Yes 17-8 is better, particularly if the last one is a win :D
i reckon we'll hit 40% sooner than expected. 40% will be achieved half way through 2012 if you ask me.

a lot of average teams running around in the AFL at present with the inclusion of the two add-ons.
conservatively, can't see us dropping more than a handful of games this season and next.

40% - FAIR DINKUM! :shock: :D

great graph


noob
Club Player
Posts: 1762
Joined: Mon 09 Jun 2008 10:32am

Post: # 1019045Post noob »

If you go by history of the percentage of how it would look after 22 rounds each year.. It's roughly 9 wins and 13 losses.
22 rounds x .4% = 8.8


linz
Club Player
Posts: 1209
Joined: Wed 27 Jul 2005 8:11pm
Has thanked: 1 time
Been thanked: 4 times
Contact:

Post: # 1019048Post linz »

Great graph work. You're not related to Allan Kohler by any chance are you?

He was and still is a great graph person. A good one he came up with is the correlation with China's electricity use with the Aussie $. They are uncannily but maybe understandably linked.

Good coaches seem to improve our lot too, particularly defensive coaches. I believe Yabby and Ross are on good talking terms.


I once spent a year in Adelaide, I think it was on a Sunday.
Legendary
Club Player
Posts: 1900
Joined: Mon 04 Aug 2008 11:35am
Has thanked: 1 time
Been thanked: 56 times

Post: # 1019067Post Legendary »

linz wrote: I believe Yabby and Ross are on good talking terms.
Chat regularly


User avatar
Enrico_Misso
Saintsational Legend
Posts: 11662
Joined: Tue 13 Jun 2006 12:11am
Location: Moorabbin Chapter of The Royal Society of Hagiographers
Has thanked: 315 times
Been thanked: 720 times

Post: # 1019074Post Enrico_Misso »

noob wrote:If you go by history of the percentage of how it would look after 22 rounds each year.. It's roughly 9 wins and 13 losses.
22 rounds x .4% = 8.8
Yes
or 8.66 to be more precise
8.66 wins to 13.34 losses
a net gap of 4.68 losses in a 22 round season

But that "gap" soon adds up.
Taken over our history (including finals) it grows to 467.
467 more losses than wins.
That is a mighty big number!

But at least we are slowly pegging it back.


The rest of Australia can wander mask-free, socialise, eat out, no curfews, no zoning, no police rings of steel, no illogical inconsistent rules. 
They can even WATCH LIVE FOOTY!
User avatar
Enrico_Misso
Saintsational Legend
Posts: 11662
Joined: Tue 13 Jun 2006 12:11am
Location: Moorabbin Chapter of The Royal Society of Hagiographers
Has thanked: 315 times
Been thanked: 720 times

Post: # 1019075Post Enrico_Misso »

linz wrote:Great graph work. You're not related to Allan Kohler by any chance are you?
Yeah big fan of Kohler.
And the KGB
(That's Kohler/ Gottliebsen/ Bartholomuesz)

Check out their website ...
http://www.businessspectator.com.au/


The rest of Australia can wander mask-free, socialise, eat out, no curfews, no zoning, no police rings of steel, no illogical inconsistent rules. 
They can even WATCH LIVE FOOTY!
User avatar
hungry for a premiership
Club Player
Posts: 856
Joined: Fri 08 Oct 2010 2:01am

Post: # 1019081Post hungry for a premiership »

Fantastic graph work!

I agree with other posters that it'd be fascinating to see how we compare against each other individual team. I know that teams like carlton and essendon have accumulated a ridiculous lead on us over the years in terms of wins vs losses. Tell me, are there any teams, particularly any traditional teams, that we actually have more wins than losses against?


"Too big, too strong, too whatever."
User avatar
ChicagoSaint
Club Player
Posts: 1405
Joined: Tue 13 Jul 2010 3:15pm
Location: Seaford

Post: # 1019086Post ChicagoSaint »

:lol: Alan Kohler ffs LMFAO! - fond of a good graph our man alan


User avatar
Enrico_Misso
Saintsational Legend
Posts: 11662
Joined: Tue 13 Jun 2006 12:11am
Location: Moorabbin Chapter of The Royal Society of Hagiographers
Has thanked: 315 times
Been thanked: 720 times

Post: # 1019095Post Enrico_Misso »

hungry for a premiership wrote:Tell me, are there any teams, particularly any traditional teams, that we actually have more wins than losses against?
Depends what you call "traditional".

Of the original (as in 1897) clubs - NONE
Of the other old clubs - TWO
- against North we are 74W 71L 2D
- against Dogs we are 76W 70L 3D
Both are tight and we were behind both of them just a few years ago.

Of the newbies - ONE
- against Freo we are 13W 11L
(so our current run of 6 wins has got us up there)

Technicalities - ONE
- against University we are and will remain 8W 6L

So the answer is FOUR

But note
- we are only 3 wins behind Adelaide
- we are only 2 wins behind Brisbane
- we are only 3 wins behind Hawthorn
- we are only 3 wins behind Port Adelaide
- we are only 4 wins behind West Coast

So another two or three good seasons and we could be in front of NINE clubs !!!

As for the rest? - don't even go there (our net 467 more losses than wins has to be distributed somewhere)


The rest of Australia can wander mask-free, socialise, eat out, no curfews, no zoning, no police rings of steel, no illogical inconsistent rules. 
They can even WATCH LIVE FOOTY!
I Love Peter Kiel
Club Player
Posts: 1717
Joined: Thu 24 Sep 2009 2:18am
Location: Noble Park

Post: # 1019286Post I Love Peter Kiel »

Excellent post EM.

Yes I love a good graph and love Kohler's graphs...they often compare different data from different eras and make a connection.

Re the figures since '87 and the start of the AFL in '90, we are probably one of the most successful clubs (Premierships aside) .
For example, Richmond's winning percentage would be pretty poor. Collingwood were pretty ordinary from about the mid '90s and again from 2004-'07, and Hawthorn had some some weak periods. It annoys me that even Carlton has won a flag in this time!
The 'greatest team ever' (Essendon 2000...which only won one flag) has been very ordinary since about 2003.

I would love a flag, but I'm still enjoying this 'era'...a lot of wins for the Saints!


In honour of those who went before, in the dark and desperate years.
User avatar
Munga
Saintsational Legend
Posts: 5286
Joined: Tue 09 Mar 2004 12:00am
Has thanked: 525 times
Been thanked: 98 times

Post: # 1019309Post Munga »

I love this stuff, great work mate!

Can you add a 10 year moving average to it? Would be good to see the peaks of good eras, and the troughs of the duds.


Gehrig emerged from scans yesterday saying he was "as sweet as a bun"
User avatar
kosifantutti23
SS Hall of Fame
Posts: 2388
Joined: Fri 26 Sep 2008 12:55am
Location: Horgen

Post: # 1019959Post kosifantutti23 »

I Love Peter Kiel wrote: Re the figures since '87 and the start of the AFL in '90, we are probably one of the most successful clubs (Premierships aside) .
For example, Richmond's winning percentage would be pretty poor. Collingwood were pretty ordinary from about the mid '90s and again from 2004-'07, and Hawthorn had some some weak periods. It annoys me that even Carlton has won a flag in this time!
The 'greatest team ever' (Essendon 2000...which only won one flag) has been very ordinary since about 2003.
For the last 20 years we are the 8th best team. (4 teams below us have won 5 flags)
For the last 10 years we are the 7th best team (2 teams below us have won flags)
For the last 7 years we are the 2nd best team (5 teams below us have won flags)
For the last 2 years we are the best team (2 teams below us have won flags)


Furtius Quo Rdelious
User avatar
saint3d
Club Player
Posts: 732
Joined: Thu 23 Aug 2007 8:34pm
Location: M14
Has thanked: 1 time

Re: StKilda all time WL ratios (2010)

Post: # 1019967Post saint3d »

Enrico_Misso wrote:We need another 467 (net) wins to reach the 50% benchmark.
That would take almost 19 consecutive "perfect" seasons (25W 0L)
If you define a goodish season as say 14 wins and 10 losses.
Then it would require 117 consecutive goodish average seasons before we reached 50%, so bookmark 2127.
With the expanded competition, it's only 18 perfect seaons or a measly 77 'goodish' seasons!


Post Reply